Sunday, 5 February 2012
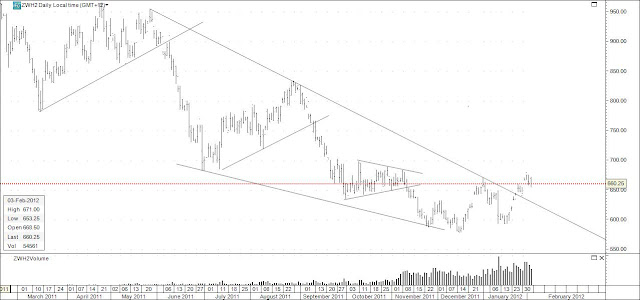
Wheat bullish wedge break
Most of the talk around at the moment is bearish for wheat with good rains forecast. However the technicals look more bullish. The March chart above shows wheat breaking up out of a large falling wedge. Wedges typically return to their starting point which in this case would be up around the 900 to 950 level. A move back down within the wedge would negate my bullish view.
Copper triangle breaks on the upside
In my December 26th, 2011 blog I warned that Copper was forming a clear converging symmetrical triangle and to wait for which way the market broke. Well as can be seen above Copper (March 2011) made a clear break to the upside and never looked back. It has hit resistance at what was previous strong support at around 390. However, the measuring implications from the triangle implies 420 is still a possibility. Probably wise to consider recent support in the 372-377 area as a stop-loss point.
Aussie Dollar triangle breakout
The weekly Aussie dollar chart above has now had 2 triangle breaks. One a few weeks ago around the 1.0500 level out of a large symmetrical triangle which started forming in July 2011, and another break upwards through an ascending or flat top triangle with the critical level being 1.0750. The measuring implications from even the smaller ascending triangle are huge with the potential for the Aussie to reach 1.21000 or about 13 cents higher. My only warning on this would that large triangles after markets have already moved a long way in the same direction can sometimes disappoint by not fulfilling all their measurement potential. However at this stage I'll go with the 1.21000 level.
Euro possible Head and Shoulders
The channel breakout in the Euro I pointed out in my previous euro update certainly proved to be important. Channel formations are not necessarily reversal patterns on their own but a potential Head and Shoulders bottom could be forming as well now with the neckline now around 1.32000. Should the Euro close clearly above this line I'd expect a further advance to the 1.3800 level. Often breaks from h&s patterns retrace to the breakout point before continuing the move in the direction of the original break. So watch out for that.
Of course on the fundamental side the next major move seems to hinge on Greek debt talks although as a technical analyst I try to ignore the news and focus on the price action. The market still feels like the big traders are very very short to me and that's a recipe for massive short covering should this pattern above play out.
Subscribe to:
Comments (Atom)


