Aussie Dollar

Whilst in the short term the Aussie looks like wanting to pull back a bit as per my previous post, the whole move down from the 2011 high at 1.1000 looks corrective and is contained within a downward sloping channel. So watch for a break of that channel to signal if a major upmove probably beyond 1.1000 is getting underway. This would have to coincide with a collapse of the USD and a commodity boom.
Euro
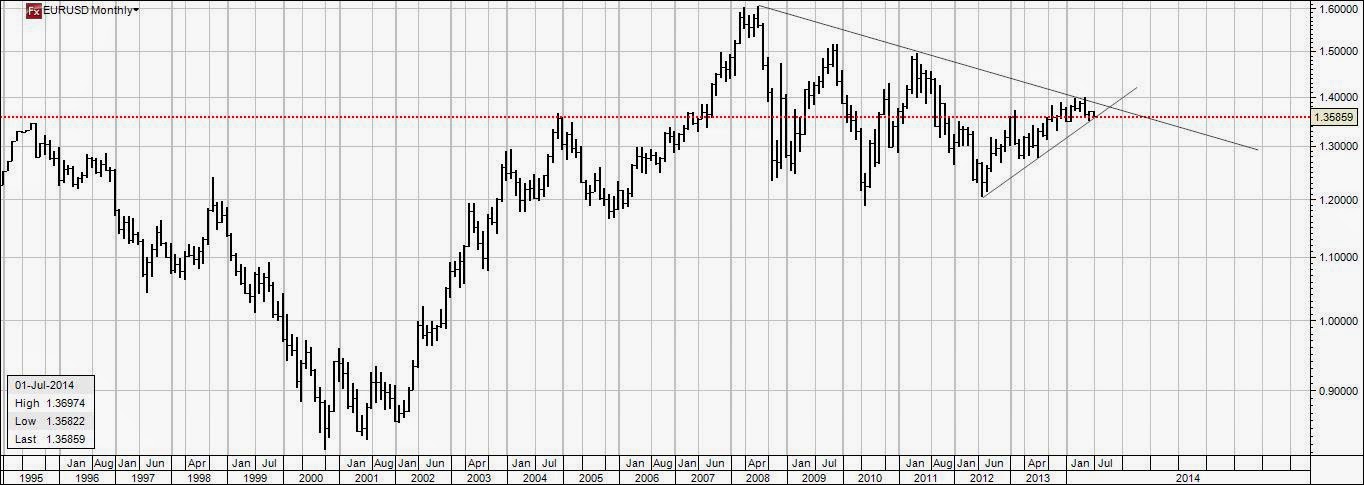
It's been a long wait since the 2008 top in the Euro. We've really gone nowhere for 5-6 years and I feel the whole move is corrective to the next big upmove to new all-time high. I'd expect that if the downtrend line I've shown on this chart is clearly breached we'd be looking at a 40 big figure move which would eventually take the Euro to the 1.80 -2.0 level. This would coincide with my view that although the USD will have some short-term strength soon, the end game will be a USD rout.
Dollar Index

The US Dollar index probably gives the clearest picture of the consolidation that's been going on since the 2008 financial crisis. The Federal Reserve through its massive money printing has only just contained deflation and that slight deflation has kept gold down and the currency up or sideways anyway. There is probably still a little USD strength left which may try for the top of this symmetrical triangle.
However I suspect the USD will eventually break downside out of this for it's final calamitous nosedive as people exit the Buck in droves realising it is becoming worthless with still billions of dollars being printed every month even with scaling back. Massive inflation, even hyperinflation will still eventually be the result of the Fed's excess and they will be powerless to stop it or to hold back the tide of USD sellers. Will they raise interest rates to defend the dollar and thereby killing the domestic economy and the stock market even more?
Where the final bottom is I'm not sure. It could be terrifying involving the US government defaulting on worthless bonds, the stock market tanking 90% and gold ( after first going down to $1000 or so, making new highs.
So watch for a break of this triangle. It could break upwards I admit so that would mean the game has changed for some reason and I wouldn't stand in its way.
British Pound

I've been fighting this market for a while. I had thought Cable had broken down out of a triangle in 2012, and it did go a little way. however there was not only no follow through but the market has reversed and pooped out the top instead causing me to re-draw the triangle with a new bottom line,
I know Elliott wavers are still calling this as a correction to a bigger downtrend but I've changed horses and now favour the upside long-term. Sure we could get a pull-back to the breakout, and in fact I think it's likely , but the bigger picture suggests a retest of the 2007 highs around 2.000 to me. A clear break of previous highs and the channel Cable has been in between 2.00 and 1.400 could see the market making new territory all the way up to 2.50 to 2.60. If the USD collapse I think is coming happens then this is quite possible.
Silver

I've always expected Silver to still get down to the $15 level which is an obvious level of next support. The triangle top it dropped out of in 2013 still suggests that, and a break of recent support at around 18.50 would see $15 in pretty quick time I imagine.
Longer term I can see the possibility the whole move from 2011 has been corrective and a break up through the channel I've drawn would signal the runaway inflation phase of certainly the US economy, but probably the developed world too. There would then be a strong argument for new all-time highs above $50 and who knows where above that. I think there needs to be at least one more shake out in silver and gold to clear the remaining weak longs before the serious investors move in.
Gold

Not surprisingly Gold looks similar to Silver and I'm expecting a break to new lows to around the $1000 mark before any uptrend resumes. That would fit nicely with a retest of the lower boundary of the channel I've drawn above. A break above this channel would signal a resumption of the Gold bull-market probably to new highs courtesy of the Federal Reserve printing press and rampant inflation once the next deflation phase completes.
New Zealand (Kiwi) Dollar

And the Kiwi has just broken up out of a symmetrical triangle which has been developing since 2011. As long as it doesn't fall back inside this the Kiwi looks destined for somewhere near .9200 and maybe even parity with the buck if the USD collapse ensues as I suspect.
Dow Jones

I've always expected the Dow would follow the NASDAQ eventually and lose 90% of its value. That would many a Dow around 2000. The broadening formation I've drawn above could be showing how that could happen. Just kissing the top line I've drawn on the chart, if the Dow were to put in a top here, and the US dollar collapses, I'd fear the 2000 level is a real possibility. Of course until the market shows a valid technical topping pattern we still have a bull market, but I think we are at a very important juncture here with the rise from 2009 lows fuelled only by the Federal Reserve printing press. In effect the wealth of middle Americans has been eroded to keep the stock market and big banks afloat. If it all starts to unravel there will be nowhere to hide. Printing more money will only exacerbate the situation. The Fed knows that and must be scared to death.
No comments:
Post a Comment