New Website!
You can now follow MarktCharts at our new website Marktcharts.com . The content will be updated more regularly and for this premium service we will be charging a small monthly fee for more recent content.
So click on Marktcharts.com now and join us for all the latest technical analysis.
Mark Thiele
Tuesday, 18 November 2014
Sunday, 6 July 2014
Currencies and Dow - The Big Picture
I thought I'd have a look at some really long-term charts of the currencies and stock market to get a different perspective. Just a brief comment on each.These are monthly charts so not easy to trade off.
Aussie Dollar

Whilst in the short term the Aussie looks like wanting to pull back a bit as per my previous post, the whole move down from the 2011 high at 1.1000 looks corrective and is contained within a downward sloping channel. So watch for a break of that channel to signal if a major upmove probably beyond 1.1000 is getting underway. This would have to coincide with a collapse of the USD and a commodity boom.
Euro
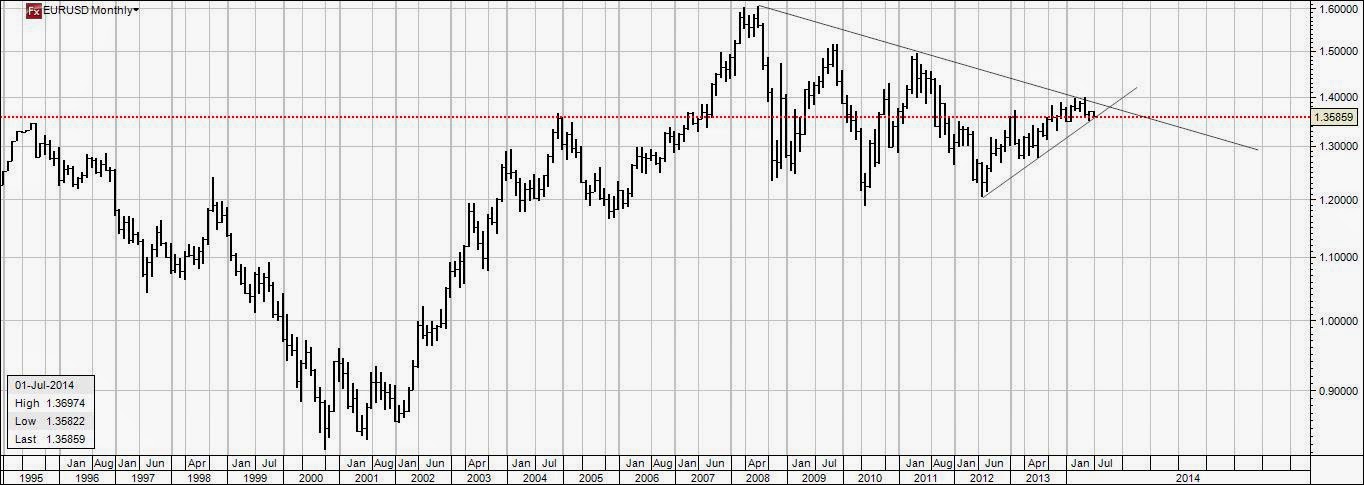
It's been a long wait since the 2008 top in the Euro. We've really gone nowhere for 5-6 years and I feel the whole move is corrective to the next big upmove to new all-time high. I'd expect that if the downtrend line I've shown on this chart is clearly breached we'd be looking at a 40 big figure move which would eventually take the Euro to the 1.80 -2.0 level. This would coincide with my view that although the USD will have some short-term strength soon, the end game will be a USD rout.
Dollar Index

The US Dollar index probably gives the clearest picture of the consolidation that's been going on since the 2008 financial crisis. The Federal Reserve through its massive money printing has only just contained deflation and that slight deflation has kept gold down and the currency up or sideways anyway. There is probably still a little USD strength left which may try for the top of this symmetrical triangle.
However I suspect the USD will eventually break downside out of this for it's final calamitous nosedive as people exit the Buck in droves realising it is becoming worthless with still billions of dollars being printed every month even with scaling back. Massive inflation, even hyperinflation will still eventually be the result of the Fed's excess and they will be powerless to stop it or to hold back the tide of USD sellers. Will they raise interest rates to defend the dollar and thereby killing the domestic economy and the stock market even more?
Where the final bottom is I'm not sure. It could be terrifying involving the US government defaulting on worthless bonds, the stock market tanking 90% and gold ( after first going down to $1000 or so, making new highs.
So watch for a break of this triangle. It could break upwards I admit so that would mean the game has changed for some reason and I wouldn't stand in its way.
British Pound

I've been fighting this market for a while. I had thought Cable had broken down out of a triangle in 2012, and it did go a little way. however there was not only no follow through but the market has reversed and pooped out the top instead causing me to re-draw the triangle with a new bottom line,
I know Elliott wavers are still calling this as a correction to a bigger downtrend but I've changed horses and now favour the upside long-term. Sure we could get a pull-back to the breakout, and in fact I think it's likely , but the bigger picture suggests a retest of the 2007 highs around 2.000 to me. A clear break of previous highs and the channel Cable has been in between 2.00 and 1.400 could see the market making new territory all the way up to 2.50 to 2.60. If the USD collapse I think is coming happens then this is quite possible.
Silver

I've always expected Silver to still get down to the $15 level which is an obvious level of next support. The triangle top it dropped out of in 2013 still suggests that, and a break of recent support at around 18.50 would see $15 in pretty quick time I imagine.
Longer term I can see the possibility the whole move from 2011 has been corrective and a break up through the channel I've drawn would signal the runaway inflation phase of certainly the US economy, but probably the developed world too. There would then be a strong argument for new all-time highs above $50 and who knows where above that. I think there needs to be at least one more shake out in silver and gold to clear the remaining weak longs before the serious investors move in.
Gold

Not surprisingly Gold looks similar to Silver and I'm expecting a break to new lows to around the $1000 mark before any uptrend resumes. That would fit nicely with a retest of the lower boundary of the channel I've drawn above. A break above this channel would signal a resumption of the Gold bull-market probably to new highs courtesy of the Federal Reserve printing press and rampant inflation once the next deflation phase completes.
New Zealand (Kiwi) Dollar

And the Kiwi has just broken up out of a symmetrical triangle which has been developing since 2011. As long as it doesn't fall back inside this the Kiwi looks destined for somewhere near .9200 and maybe even parity with the buck if the USD collapse ensues as I suspect.
Dow Jones

I've always expected the Dow would follow the NASDAQ eventually and lose 90% of its value. That would many a Dow around 2000. The broadening formation I've drawn above could be showing how that could happen. Just kissing the top line I've drawn on the chart, if the Dow were to put in a top here, and the US dollar collapses, I'd fear the 2000 level is a real possibility. Of course until the market shows a valid technical topping pattern we still have a bull market, but I think we are at a very important juncture here with the rise from 2009 lows fuelled only by the Federal Reserve printing press. In effect the wealth of middle Americans has been eroded to keep the stock market and big banks afloat. If it all starts to unravel there will be nowhere to hide. Printing more money will only exacerbate the situation. The Fed knows that and must be scared to death.
Aussie Dollar
Whilst in the short term the Aussie looks like wanting to pull back a bit as per my previous post, the whole move down from the 2011 high at 1.1000 looks corrective and is contained within a downward sloping channel. So watch for a break of that channel to signal if a major upmove probably beyond 1.1000 is getting underway. This would have to coincide with a collapse of the USD and a commodity boom.
Euro
It's been a long wait since the 2008 top in the Euro. We've really gone nowhere for 5-6 years and I feel the whole move is corrective to the next big upmove to new all-time high. I'd expect that if the downtrend line I've shown on this chart is clearly breached we'd be looking at a 40 big figure move which would eventually take the Euro to the 1.80 -2.0 level. This would coincide with my view that although the USD will have some short-term strength soon, the end game will be a USD rout.
Dollar Index
The US Dollar index probably gives the clearest picture of the consolidation that's been going on since the 2008 financial crisis. The Federal Reserve through its massive money printing has only just contained deflation and that slight deflation has kept gold down and the currency up or sideways anyway. There is probably still a little USD strength left which may try for the top of this symmetrical triangle.
However I suspect the USD will eventually break downside out of this for it's final calamitous nosedive as people exit the Buck in droves realising it is becoming worthless with still billions of dollars being printed every month even with scaling back. Massive inflation, even hyperinflation will still eventually be the result of the Fed's excess and they will be powerless to stop it or to hold back the tide of USD sellers. Will they raise interest rates to defend the dollar and thereby killing the domestic economy and the stock market even more?
Where the final bottom is I'm not sure. It could be terrifying involving the US government defaulting on worthless bonds, the stock market tanking 90% and gold ( after first going down to $1000 or so, making new highs.
So watch for a break of this triangle. It could break upwards I admit so that would mean the game has changed for some reason and I wouldn't stand in its way.
British Pound
I've been fighting this market for a while. I had thought Cable had broken down out of a triangle in 2012, and it did go a little way. however there was not only no follow through but the market has reversed and pooped out the top instead causing me to re-draw the triangle with a new bottom line,
I know Elliott wavers are still calling this as a correction to a bigger downtrend but I've changed horses and now favour the upside long-term. Sure we could get a pull-back to the breakout, and in fact I think it's likely , but the bigger picture suggests a retest of the 2007 highs around 2.000 to me. A clear break of previous highs and the channel Cable has been in between 2.00 and 1.400 could see the market making new territory all the way up to 2.50 to 2.60. If the USD collapse I think is coming happens then this is quite possible.
Silver
I've always expected Silver to still get down to the $15 level which is an obvious level of next support. The triangle top it dropped out of in 2013 still suggests that, and a break of recent support at around 18.50 would see $15 in pretty quick time I imagine.
Longer term I can see the possibility the whole move from 2011 has been corrective and a break up through the channel I've drawn would signal the runaway inflation phase of certainly the US economy, but probably the developed world too. There would then be a strong argument for new all-time highs above $50 and who knows where above that. I think there needs to be at least one more shake out in silver and gold to clear the remaining weak longs before the serious investors move in.
Gold
Not surprisingly Gold looks similar to Silver and I'm expecting a break to new lows to around the $1000 mark before any uptrend resumes. That would fit nicely with a retest of the lower boundary of the channel I've drawn above. A break above this channel would signal a resumption of the Gold bull-market probably to new highs courtesy of the Federal Reserve printing press and rampant inflation once the next deflation phase completes.
New Zealand (Kiwi) Dollar
And the Kiwi has just broken up out of a symmetrical triangle which has been developing since 2011. As long as it doesn't fall back inside this the Kiwi looks destined for somewhere near .9200 and maybe even parity with the buck if the USD collapse ensues as I suspect.
Dow Jones
I've always expected the Dow would follow the NASDAQ eventually and lose 90% of its value. That would many a Dow around 2000. The broadening formation I've drawn above could be showing how that could happen. Just kissing the top line I've drawn on the chart, if the Dow were to put in a top here, and the US dollar collapses, I'd fear the 2000 level is a real possibility. Of course until the market shows a valid technical topping pattern we still have a bull market, but I think we are at a very important juncture here with the rise from 2009 lows fuelled only by the Federal Reserve printing press. In effect the wealth of middle Americans has been eroded to keep the stock market and big banks afloat. If it all starts to unravel there will be nowhere to hide. Printing more money will only exacerbate the situation. The Fed knows that and must be scared to death.
Thursday, 3 July 2014
Aussie upthrust reversal traps bulls

In a previous post I'd been talking about watching for a breakout of a resistance level in the Aussie dollar above the line shown above. We seemingly got a strong close above this but then sharply reversed.
This looks very much like an upthrust reversal pattern. A market breaks higher through an area of congestion but fails to follow through and smartly closes back inside the original pattern. Sometimes breakout patterns fail and traders need to be quick on their feet to exit if something like this happens and even contemplate reversing their positions. At the time of writing this the Aussie has closed in New York but should it remain back inside this pattern then a re-test of the 0.9200 level looks on the cards. A break of that would signal a new downtrend.
Tuesday, 17 June 2014
Aussie dollar updated

In my previous Aussie dollar post I'd put a watch on a break out of a triangle pattern which seemed to be developing. The Aussie broke upside with a close at .9381 on June 11th and continued strongly for a couple of days as it approached a recent high.
However, I admit to being disappointed at the ensuing pull-back. I would have expected this to hold above the upper boundary of the triangle but today's close gives cause for concern. Sometimes market do slightly creep back inside formations before taking off again. The Aussie would need to show signs of quick recovery from here for me to regain confidence. I think it wiser to stand aside though and await a confirmation above a new upper line drawn above and being at the level of last week's .9435 high.
The alternative is that we are going to re-test the .9200 level. AS I said, disappointing this hasn't followed through on the upside but sometimes patterns do fail. I have to admit I've always been a bit sceptical of upside breakouts from flat bottom triangles. They are more often a bear market pattern.
But let's wait and see what develops now. The important levels are still close and I'm sure another opportunity will present itself soon.
Sunday, 8 June 2014
USDJPY next move worth the wait

Looking at the long-term chart of USD/JPY the trend is still solidly up. The original head and shoulders pattern broken in late 2012 well and truly reached its target. The large symmetrical triangle of 2013 broke upwards and should have reached 109.00. It hasn't yet made it.
That makes me wonder if the triangle now forming between 102 and 105 is going to be a continuation pattern for a push up to this 109 level.
Of course a break and close below 102 and I'd consider shorting for a move down to the 99.00 handle.
So as with Gold and the Aussie dollar the setup is there for the patient trader. Don't get too caught up in the daily noise when the better percentage plays will come.
Gold - here we go again?

It's easy to get tied up in the day-to-day or even hourly charts of gold, but when you stand back a bit the important long-term levels become clearer.
The past year looks remarkably similar to the top formed by gold 2011-2013. Now not exactly the same of course but a descending triangle of about half the size of the one which preceded the carnage (predicted by this blog) which occurred when gold broke it's support then.
Since June 2014 spot gold has been forming what also looks like a descending triangle with a support level around $1180. The lower highs indicated the most likely outcome of this formation. A decent break and close below $1180 should see another $200 fall in gold to at least the $1000 mark. A break above the falling trendline, currently around $1360 can't be ruled out of course and pre-empting either of these moves would be foolish. Better just to sit back, be patient and wait for the break. In gold you do have to be incredibly patient.
Although smaller patterns do provide shorter term trading opportunities such as the recent April/May symmetrical triangle which has pretty much reached its objective. Remember you don't always have to be in the market.
Silver also shows a similar pattern.
Aussie Dollar at important juncture

The Australian dollar sits at an important juncture at the beginning of June 2014. The important levels to watch for the next major move are clear. A flat bottomed descending triangle has been forming since early April giving traders a delicious opportunity from a technical analysis purists point of view. More often than not a descending triangle breaks the lower boundary and then proceeds in that same direction for at least the same width as the triangle itself - in this case close enough to 2.6 cents from what the breakout would be.
The breakout point is somewhere between .9199 and .9205. A clear break and close below this level is needed. Sometimes a market will break a level but not close below it casting doubt on the move.
There is also the possibility the Aussie breaks the upper descending line and continues up for the same distance. The breakout point depends on timing and where the line is as it continues to descend.
Either way this is one to be patient on and wait for the market to show you. If you can't wait then options could be the way to go - buying a put and a call just outside the current range.
Notice the current resistance occurred at a previous support level formed by a nicely symmetrical head and shoulders pattern in the September to November period in 2013. The downside count for this was fulfilled nicely at the .8770 level.
Subscribe to:
Comments (Atom)